


Time flies: The current GPU architectures Nvidia Ada Lovelace and AMD RDNA 3 have been on the market for almost 1.5 years. Nvidia started with the Geforce RTX 4090, which debuted in October 2022 and has sat on the performance throne ever since. The AMD top model Radeon RX 7900
That's the current state of knowledge – but is that still true? After all, manufacturers are squeezing more and more performance out of their products through continuous driver updates. Asked, done. We strapped the two GPU titans Geforce RTX 4090 and Radeon RX 7900 One could consider this comparison to be unfair, because one graphics card costs almost twice as much as the other (specifically: RTX 4090 from 1,789 euros, Radeon RX 7900 XTX from 949 euros). We still think the comparison is obvious and exciting because it shows what is currently possible at best – and the cheaper model has the chance to score points when it comes to price-performance.
Geforce RTX 4090 vs Radeon RX 7900 XTX
Before we turn our attention to the benchmarks, we would like to refresh the memory of our test subjects. As explained at the beginning, both high-end graphics cards and the underlying architectures are from 2022. A replacement is not expected until autumn of this year at the earliest; in the case of Nvidia, early 2025 is even more likely. Until then, you can have a lot of smooth fun with a Geforce RTX 4090 (Ada Lovelace) and Radeon RX 7900 XTX (RDNA 3), which we will show on the following pages.
The two graphics cards are fundamentally different, but they are comparable in some areas. The storage capacity of 24 GiBytes should be mentioned, which will also easily withstand future games and is connected at a rate of around one terabyte per second. The remaining key data differ significantly and are largely responsible for the differences in performance in games. Nvidia has 16,384 fully-fledged FP32 computing units in the field, which provide an impressive computing power of almost 90 tera-FLOPS at the typical clock speeds. AMD, on the other hand, relies on 6,144 of these computing units, which under certain circumstances – using the dual-issue function – can achieve twice the throughput and thus at best 65 TFLOPS. When RDNA 3 launched, there was some discussion about why AMD wasn't going the extra mile and installing “real” 12,288 FP32 units. The reason for this is space, as each skill costs transistors, but RDNA 3 is heavily optimized for area. The specifications of the fastest graphics cards alongside their siblings; You can find further comparison models in our well-maintained GPU database:
Graphics cardGeforce RTX 4090Radeon RX 7900 400Chip Size (Die/GCD)608.5 mm²300 mm²378.6 mm²Size Memory Cache This ( MCD)-6× ~37 = 220 mm² transistors graphics chip (billion)76,357.7 (incl. MCDs)45.9Manufacturing process4NN5 (GCD) + N6 (MCD)4NShader cluster (CUs/SMs)1289680FP32 ALUs/TMUs/ ROPs16,384/512/1766,144*/384/19210,240/320/112Ray tracing units128 (3rd Gen.)96 (2nd Gen.)80 (3rd Gen.)Matrix units512 (4th Gen.)192 (1st Gen.) . Gen.)320 (4th Gen.)Level 2 Cache (MiB)72664Level 3 Cache (MiB) 96 GPU Boost Clock in Games (MHz)2.7402.6002.730FP16 Performance ALUs (TFLOPS) 89,8127,855,9FP32 Performance ALUs (TFLOPS)89,863,955.9Fill Rate (Mtex/Mpix per sec)1,402.9/482,2998.4/499,2873.6/305.8(DLSS 3) Frame GenerationYesNoYesDriver Frame generationNoYesNoMemory connection (bit)384384256Speed RAM (GTs/MHz)21.0/10,50220.0/10,00023.0/11,500Memory typeGDDR6XGDDR6GDDR6XMemory transfer rate (GB/s)1.008960736Memory capacity (MiB)24.57624.57616. 384PCI Express Standard4.0×164.0 ×164.0 ×16Power connectors1× 16-/4× 8-pin2× 8-pin1× 16-/2- to 3× 8-pinPower consumption (board power)450 watts355 watts320 wattsDisplay connectivityDP 1.4a, HDMI 2.1aDP 2.1, HDMI 2.1a , USB-CDP 1.4a, HDMI 2.1aPrice at the time of testing (from)1.7909501.100
Performance information based on the graphics cards we tested extensively (average GPU boost across all benchmarks) – The manufacturer's information is sometimes significantly lower and therefore impractical. Depending on the model, deviations of up to 200 MHz are possible. *ALUs with “dual-issue” skills, which at best behave like twice the number. The best case is given.
Today, we can address the question of the extent to which the driver's shader compiler could mature and thus deliver performance more often using dual-issue systems with new data, but we cannot answer it conclusively. At the end of 2022, our synthetic measurement tools agreed that dual-issue was not being used on its own, so we were consistently seeing TFLOPS results in the 30s. Over the months and updates to the AMD Adrenalin software, the situation has improved and for some time now the general purpose test from AIDA64 has also confirmed a clear effect – the current results:
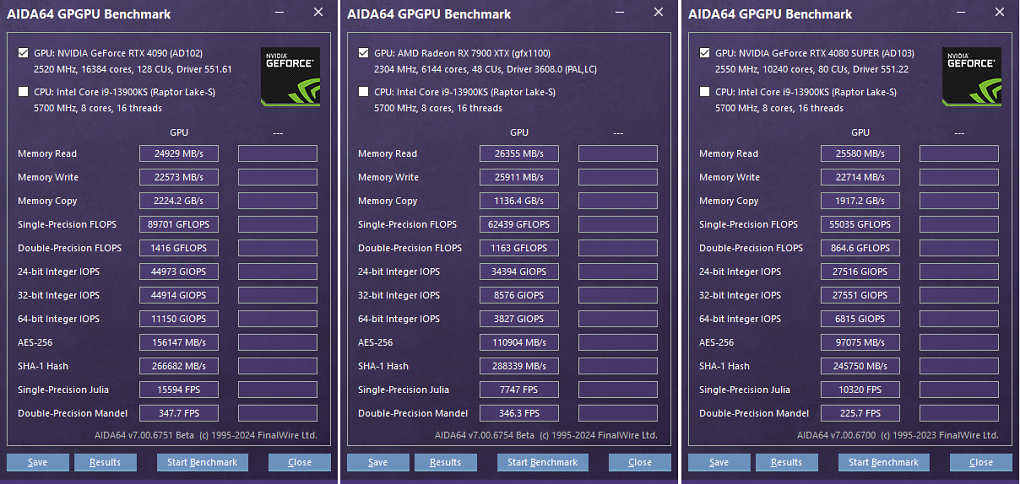
Source: PCGH Theoretical performance values - AIDA64 General Purpose Benchmark: Geforce RTX 4090 vs. Radeon RX 7900 But the competition doesn't sleep and even if Nvidia doesn't explicitly advertise performance improvements, these have undoubtedly been achieved, as our constant follow-up measurements show. That's enough of the preamble – on the following pages you will find out how the Radeon RX 7900 XTX performs against the Geforce RTX 4090 when it comes to rasterizing and ray tracing. And if you think that this comparison is unfair, you can of course also consider smaller graphics cards like the Geforce RTX 4080 Super.


